Acknowledge license to accept the repository
Our team may take 2-3 days to process your request
You agree to use this dataset exclusively in compliance with the license, which is the same as Building3D dataset. Pleas don't use mail addresses from free email providers to request data, such as gmail.com, qq.com, web.de, etc.
Log in or Sign Up to review the conditions and access this dataset content.
1. Pleas don't use mail addresses from free email providers to request data, such as gmail.com, qq.com, web.de, etc.
2. If you downloaded the dataset before March 5, please download wireframe.zip to update the ground truth of the training set. We have refined the ground truth.
1. Introduction
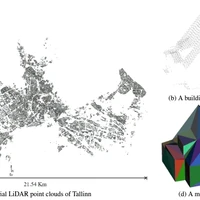
Tokyo LoD2 dataset is a subset of the BuildingWorld dataset and primarily represents commercial buildings in Tokyo's downtown area. It consists of the downtown areas of six wards, including Shinjuku, Shibuya, Minato, Itabashi, Nerima, and Chuo. The Tokyo LoD2 dataset provides 33,324 detailed LoD2 building meshes, wireframes, and simulated point clouds. In 2nd Building3D Challenge Competition, 29,852 buildings are used as the training dataset, while 3,472 buildings are used as the testing data.
In the point cloud simulation process, the density of point clouds is set to 25 points per square meter . To better approximate real-world sampled point clouds, we introduce random Gaussian perturbations along the normal directions of the point cloud. It is worth noting that we have not introduced random occlusion, which means that the simulated point cloud data is complete and does not have missing corner points or components. Additionally, the point cloud is sampled from textured building models, so it is colored and stored in 8-bit format.
2. Data Analysis
a. Point Cloud analysis
 |
 |
|---|---|
| Box Plot of the number of Point Cloud | Point Cloud Distribution After Outlier Removal |
Approximately 77% of the roof point cloud data contains fewer than 10,000 points, while approximately 60% of data has fewer than 4,096 points. If a fixed number of roof point clouds in training is required, 4,096 maybe a better choice. The number of point clouds in the Building3D dataset can also be set to 4,096, which has been proven to work effectively in the past. However, some buildings with large area have a large amount number of points with a maximum of 227,736 points. Approximately 10% of the data contains more than 20,000 points. These building data may affect the model's performance and, therefore, need to be handled with care.
The samples for the test set are drawn uniformly from the entire dataset, which maintains the consistency of the distribution between the training and testing data.
b. Wireframe analysis
 |
|---|
| Violin Plots of Wireframe |
 |
|---|
| Histogram of Wireframe |
Building3D Dataset: Excluding extremely complex buildings, the maximum number of corner points and edges can reach up to 70. The average corners are about 13, while the average edges are about 15. Interquartile Range (IQR), which is the range between the first quartile (Q1) and the third quartile (Q3), represents the middle 50% of the data distribution. The IQR of corners spans from 6 to 20, while the IQR of edges ranges from 7 to 25.
Tokyo LoD2 Dataset: Excluding extremely complex buildings, the maximum number of corner points and edges can reach up to 133. The average corners are about 32, while the average edges are about 32. Interquartile Range (IQR), which is the range between the first quartile (Q1) and the third quartile (Q3), represents the middle 50% of the data distribution. The IQR of corners spans from 10 to 58, while the IQR of edges ranges from 11 to 60.
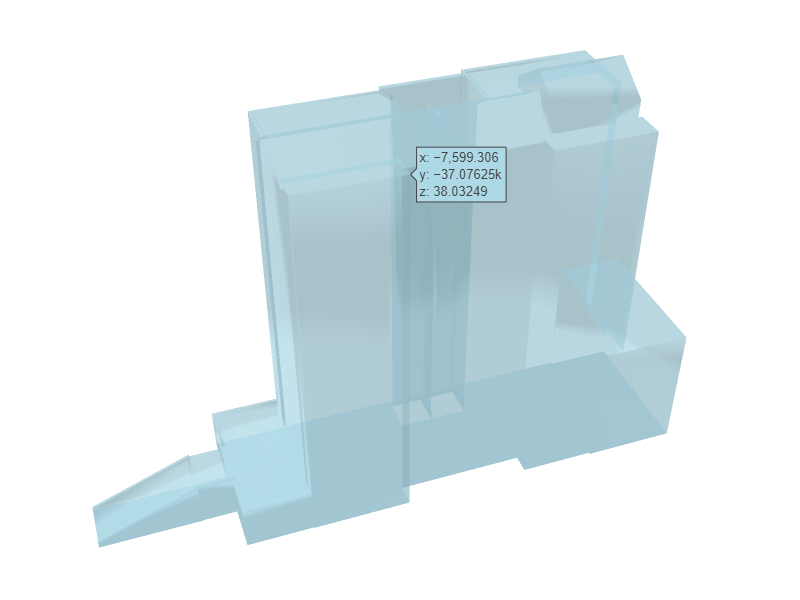
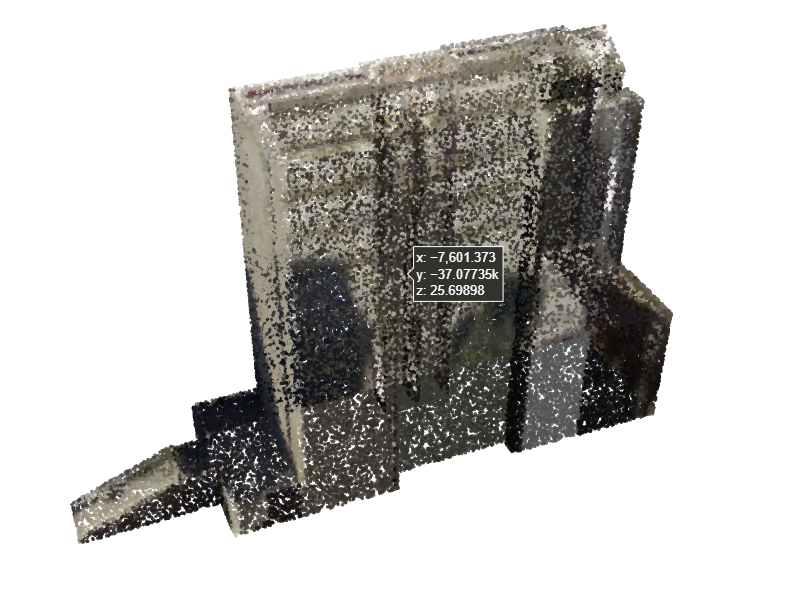
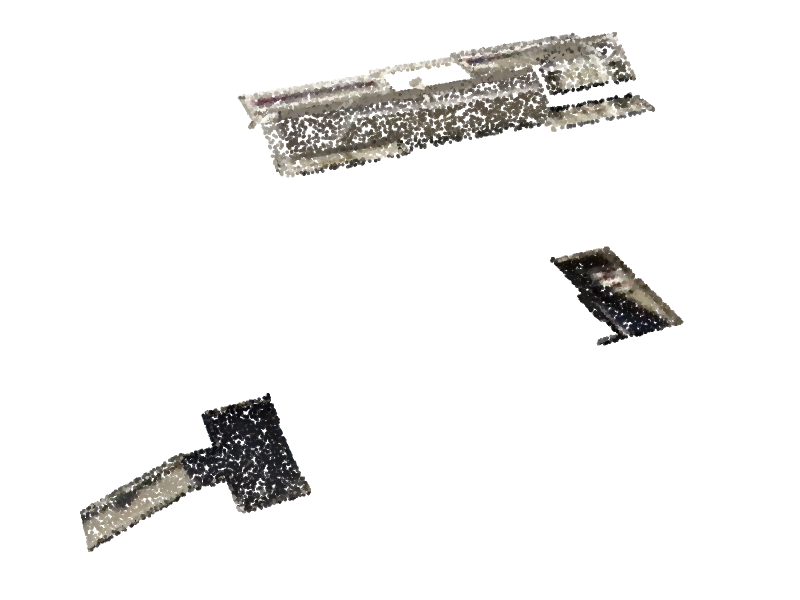
3. Tokoy LoD2 Data Interactive Visualization
 |
 |
 |
 |
- Downloads last month
- 56